The January Effect

The January Effect refers to the observation that stock returns appear much higher in January than other months. There’s a beautiful wiki on the effect ( https://en.wikipedia.org/wiki/January_effect ) so I won’t go into much detail on it, except to say that:

1. The first thing that came to my mind regarding this effect is taxes – people sell in December to harvest tax losses/gains and then rebuy in January

2. From my understanding, this effect may no longer exist – papers come out both ways on this with recent data.

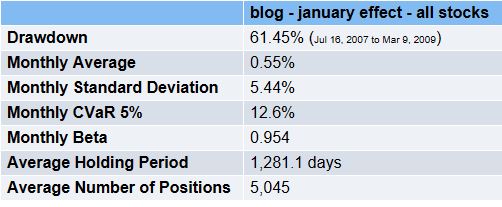
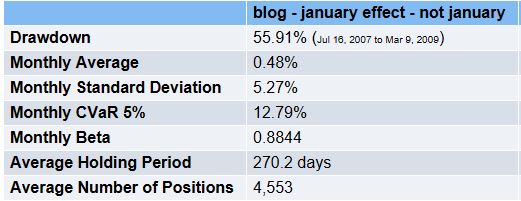
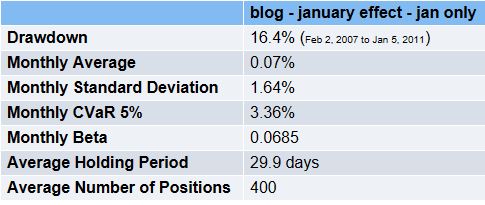
3. Here’s what Equities Lab has to say about the issue.I ran three backtests – all used data from Jan 1 2000 to today, had a monthly rebalance over all stocks (including illiquid small stocks) – the first does all months, the second does all months except January and the third does January only.

allstocksjan

nonjan

janonly

To compare the three, we can normalize everything to 12 month returns –

All months annual returns = 1.0055^12 –> 6.8%

Non January returns = (1.0048^(12/11))^12 –> 6.5%

January only returns = (1.0007^(12/1))^12 –> 10.6%

In light of this evidence, I think there’s a case to be made that some version of the January Effect still exists.


Gross Profitability Anomaly

A recent anomaly (aka a piece of data that predicts future stock returns well without any apparent addition to risk) that has been discussed heavily over the last 5 years or so is the Gross Profitability Anomaly. This anomaly was formally documented by Robert Novy-Marx in 2009 and a version of the paper can be found here: http://papers.ssrn.com/sol3/papers.cfm?abstract_id=1598056 


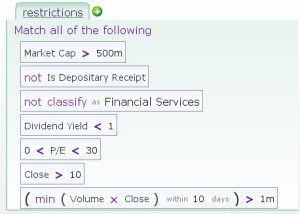
Gross profitability is simply (revenues – COGS) / Total Assets. In the implementation below, I divide trailing 12 month (revenues – COGS) by assets as of the last quarterly or annual report. To make sure results are not driven by illiquid/small cap stocks/some other weird stuff, I apply my standard restrictions screen to reduce the universe of investible stocks to those that are actually trade-able in size.

restrictions

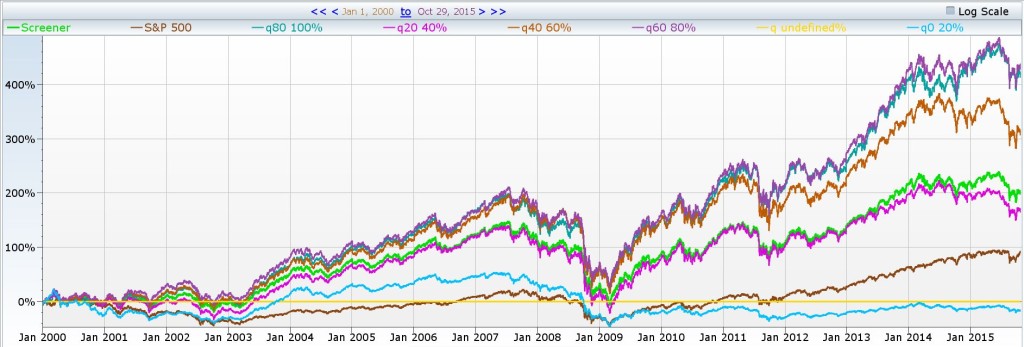
Within the set of stocks that pass these restrictions, I sort stocks into quintiles (5 buckets) based on gross profitability and follow these quintiles, rebalancing quarterly. The backtests are below:

profitability quintiles


We can see the top 2 quintiles (top 40%) of stocks, ranked by the gross profitability metric quintuple our investment vale over the last 15 years; the market roughly doubles over the last 15 years and the lowest quintile (or bottom 20%) of gross profitability stocks *lose* money.

This is all the more remarkable when you consider that one of my restrictions above was a 0 to 30 PE … so we aren’t event including stocks that lose money in the bottom quintiles!

Sorting by profitability appears to enhance standard value screens and if you use value strategies, consider adding a profitability element to them to maximize your returns.


A discussion on replicating the Magic Formula

I have been asked numerous times about Joel Greenblatt’s Magic Formula ( https://www.magicformulainvesting.com/ ) in reference to quantitative investing.

In this blog post, I’ll share the most recent email exchange I had regarding the topic, and an excerpt from my book that covers the Magic Formula (MF). I think the exchange is informative as to how I view replicating other practitioner and scholarly work … to sum it up, exact replication is not only likely impossible, but could be a gigantic waste of time – data sources are often different, minuscule differences in analytical methods  lead to significantly different results.

I think this email exchange is instructive for understanding some of the issues and some of the goals quant investors often start with,. These goals of replication before creation are noble, but beyond a point, perfect replication is not particularly useful.

Initial email:

“I stumbled across your book, Principles of Quantitative Equity Investing, on Google Scholar while looking for more information on the work of Joel Greenblatt. Your book sounds like it focuses on his much acclaimed stock screen. I am looking for research on proving out his back-testing (essentially a “second test of his back-testing”). As you are undoubtedly aware he does not go into the finer details of how he sets up his screen. Is this something you show in detail in the book using Equities Lab?”

My 1st reply:

“Hi <interested investor>,

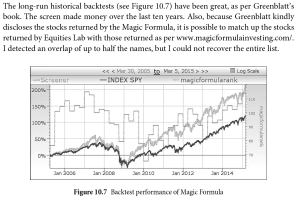
I do have a section on the MF (although that’s not the “focus” of the book). I do show how to replicate it, although both backtests and holdings don’t always line up exactly with those from the website and book.

You can look at my backtest below and the text preceding it (and actually, if you buy the book, it includes the software to do the backtest yourself).

pastedImage

Hope this helps – let me know if you need anything else.”

Reply to my email:

“Thanks for your response and the exert (sic) from your book, Sugata, much appreciated!

You mention you are able to return up to half of the stocks he does. Have you managed to improve on this since writing the book? I should also ask, do you use any of the quantitative methods you wrote about to manage your own portfolio? Given the apparent strength of the Greenblatt formula, it is strange to not see it publicised more. You show great results with it yourself, were you convinced?

Using S&P Capital IQ (I have an account through my employer) I manage to return about 2/3s of his list. Though I seem to have maxed out increasing this number by tinkering with the screen, hence my search for research done by others. I am also keen to apply it to other countries (in particular, the UK, <redacted>). I can’t do this until I have done the back-test myself. …”

My reply with answers:

“Answers below.

I’m happy to discuss further.

SR”

and then I answered my reader’s questions in-line in the email:

You mention you are able to return up to half of the stocks he does. Have you managed to improve on this since writing the book?

No – but I don’t really care to – why bother?

I should also ask, do you use any of the quantitative methods you wrote about to manage your own portfolio?

Yes.

Given the apparent strength of the Greenblatt formula, it is strange to not see it publicised more. You show great results with it yourself, were you convinced?

There are many other “formulas” out there – I think MF is an ok value based screen and value investing definitely works. I use simple PE ratios for my value screening, which also works very well. But then, value is only 1 of the 6 or 7 things I look for.

Using S&P Capital IQ (I have an account through my employer) I manage to return about 2/3s of his list. Though I seem to have maxed out increasing this number by tinkering with the screen, hence my search for research done by others.

Why try to recreate his list? I don’t see the point. I think a 2/3 match is good enough to know you’ve got the general idea right.

I am also keen to apply it to other countries (in particular, the UK, <redacted>). I can’t do this until I have done the back-test myself. Coming across historic index data is difficult though.

I’ve done little international work – I use Bloomberg – they have a powerful (if somewhat clunky) screening and backtesting product. The commands are EQS and EQBT if you’re interested.”

What is backtesting

Backtecting is simulating how a strategy would have performed, had we been following it historically

For example, if our strategy were: buy all profitable stocks in equal amounts, and rebalance quarterly ….

  1. Backtesting over 10 years would start in Oct 19th 2005,
  2. divide our money equally between all stocks that were profitable then,
  3. hold them until Jan 19th 2006,
  4. sell them at prices from Jan 19th 2006,
  5. reinvest the proceeds into stocks profitable in Jan 2006
  6. rinse and repeat until today … 40 quarters later

The report for the backtest would present how this strategy would have performed historically, and we could compare this to the index returns or other returns.

Value investing I

Value investing : this is the most common of all quantitative strategies. From the famous Magic Formula (https://www.magicformulainvesting.com/ ) to funds like LSV (http://lsvasset.com/ ) numerous practitioners use value investing concepts quantitatively to enhance their returns.

In a nutshell, value investing is buying things that are “cheap.” But cheap relative to what? Usual comparisons are to earnings, cashflows or book values. For example, Here’s a backtest of three strategies:

1. investing in stocks with a PE of 0 to 18. !8 is a rough estimate for overall levels of market PE over time (although currently, the PE is the market is a bit higher)

2. investing in stocks whit a PE more than 18

3. investing in stocks with negative earnings – note that these stocks do not have a defined PE ratio, since negative earnings typically render the ratio meaningless.

value1The green line is the backtest of the 0 to 18 PE, the blue line is the backtest of the 18+ PE strategy and the purple line is the backtest of the negative earnings strategy. Buying low PE stocks is definitely better for your net worth, over the long run. You may notice the initial blip up in the purple line…. that was the dot com bubble.

These backtests are generated by Equities Lab (www.equitieslab.com). You can conduct your own backtests for your own strategies using the software. If you are interested in learning more, you can also look at my book on Quantitative Investing .