Low Volatility strategies have become recent darlings in the smart beta space. Since the financial crisis of 2008, there has been tremendous interest in low volatility funds (see http://www.pionline.com/article/20151130/PRINT/311309977/low-volatility-strategies-soar-as-investors-reduce-risks for example). At the same time, there is some reluctance: see http://servowealth.com/resources/articles/dont-get-lured-low-volatility-strategies and http://www.etf.com/sections/index-investor-corner/beware-how-low-vol-anomaly-works?nopaging=1 .
In addition to some of the arguments raised in the 2 sites above, one argument I’ve been considering against low volatility is that low volatility basically proxies for value, in many ways. This makes intuitive sense, as low volatility stocks are likely to be unglamorous, plodding along, generating cashflows that don’t change much – very much like value stocks.
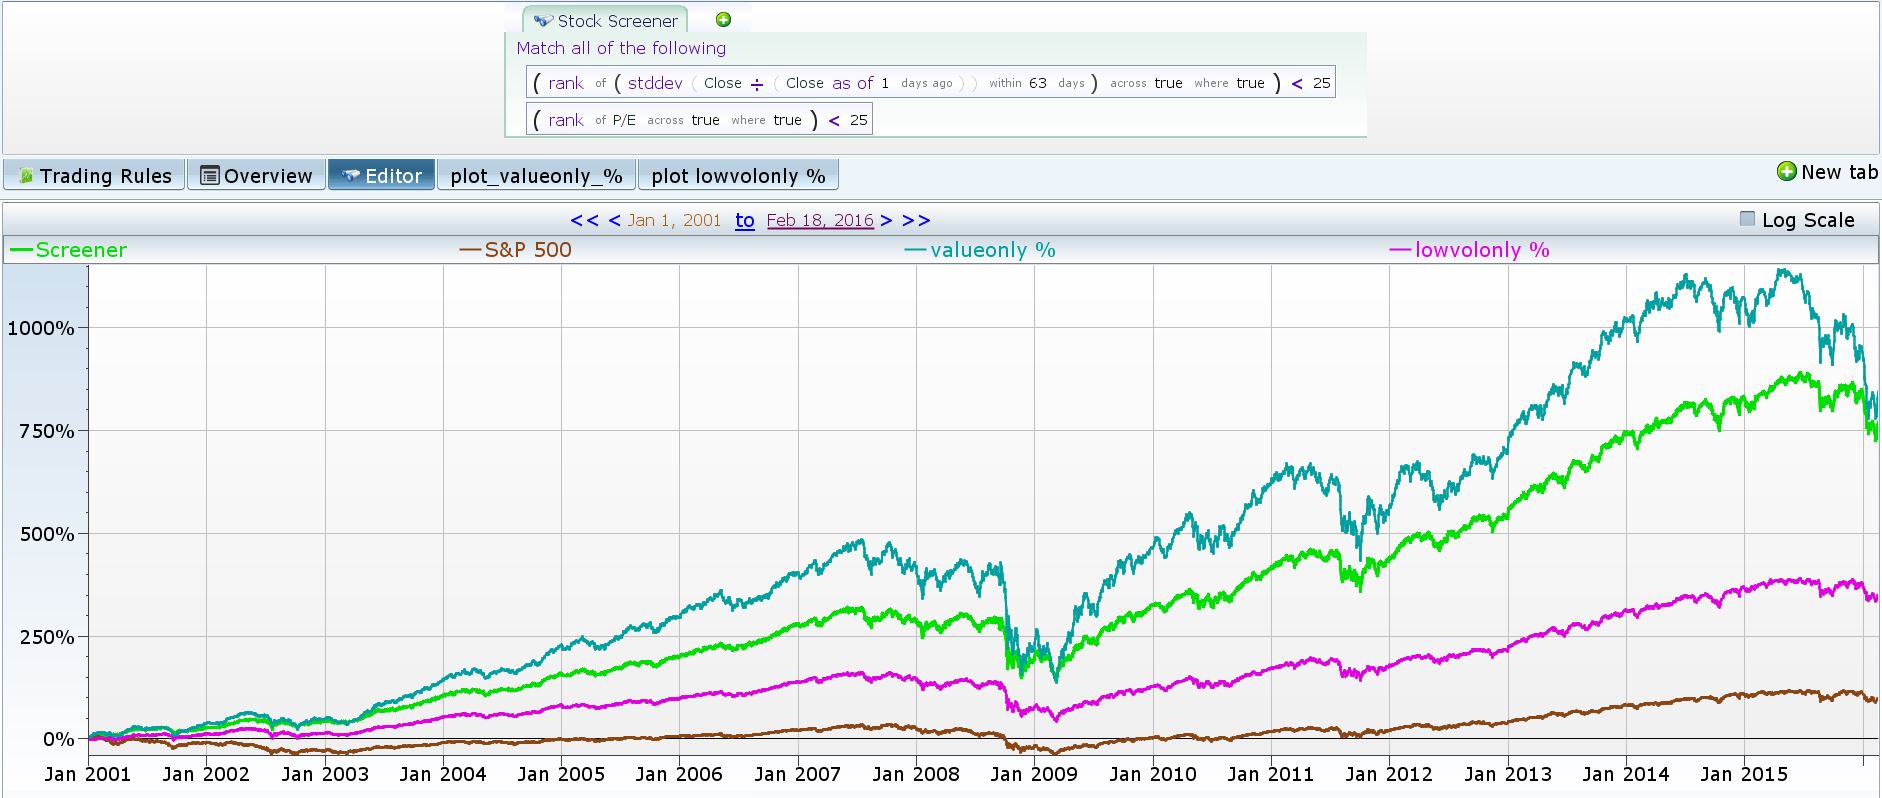
To test this, I ran 3 separate backtests… a value screener (bottom 25% of stocks by PE), a low volatility screener (bottom 25% of stocks by last quarter daily return std. deviation) and a value AND volatility (or what I call valuatility!) screen. The results over the last 15 years are interesting… value > valutility (the screener)>>> low vol only >>> S&P.
Additionally, while it overlap is small [ bottom 25% of std dev has abotu 900 stocks, bottom 25% of PE has about 700 and intersection has about 100 ], the returns to the factors definitely seem correlated. Contrast this with the momentum factor, for example, and you can see that there are more points of dissimilarity (see below, the momentum strategy is top 25% of stocks ranked by returns from a year ago to a month ago).
* Note that the scale has been changed to log scale.
So …. if the upshot is that low vol by itself underperforms value, and it is pretty correlated with value, and adding it into the mix with value *lowers* backtest performance somewhat… I’m not really sure what to do with it.

